Is investing in data worth it? How to calculate the ROI of a BI project
No marketing. We show a simple formula for calculating the return on investment in data and BI, on a concrete example with numbers - and when the project pays off.
Richard Böhmer, MSc
“Data is the new oil.” A nice line for a conference, a poor one when approving a budget. Owners and CFOs don’t care about the buzzword - they care about one question: will I get my money back, and when? This article is about how to easily calculate the return on your investment in data and BI yourself. With a real formula and an example.
ROI in one sentence
Return on investment (ROI) is the ratio of what the project brings you to what it costs you:
ROI = (annual benefit - annual cost) / total investment × 100 %
It sounds dry, but once you plug in real numbers from your company, the decision suddenly gets a lot easier.
Where the value comes from
The benefit of a data project almost always comes from four sources:
- Time saved - no more manually assembling reports in Excel. If two people spend 40 hours a month merging data, at a labour cost of €25/h that’s €12,000 a year saved.
- Better decisions - the right prices, stock levels and campaigns. Even a 1 % margin improvement on €2M revenue is €20,000 a year.
- Fewer errors - a wrong number in a report can mean badly ordered stock or a fine. Less firefighting = hard savings.
- Faster reactions - when you see a problem today instead of a month later, you can still act while it’s cheap to fix.
A real-world example
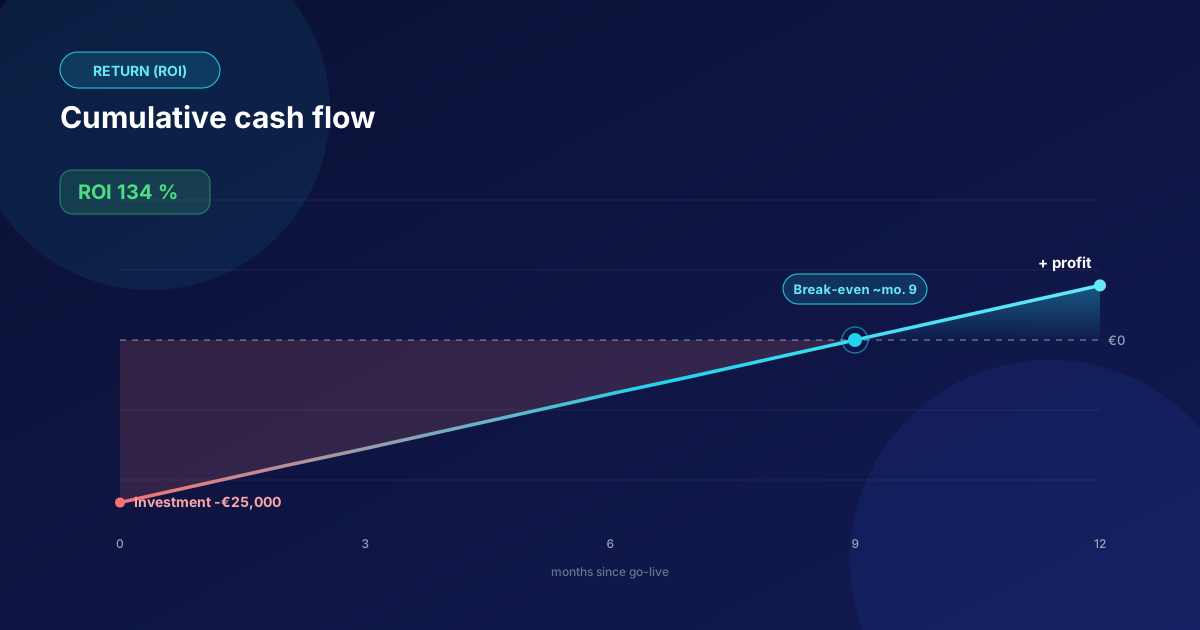
A mid-sized trading company, investment in a data warehouse and reporting of €25,000, monthly operation €300 (licences + cloud + maintenance), i.e. €3,600 a year.
| Source of value | Annual benefit |
|---|---|
| Time saved (2 people × 40 h/month) | €12,000 |
| Better decisions (+1 % margin) | €20,000 |
| Fewer errors and complaints | €5,000 |
| Total | €37,000 |
First-year ROI = (37,000 - 3,600) / 25,000 × 100 % = 134 %
So the project pays for itself in under 9 months, and every year after that is almost pure gain (you only pay for operation).
When the project pays off
Most well-designed data projects pay back within 6-12 months. Faster where:
- reports are assembled by hand for dozens of hours a month today,
- decisions have high value (prices, stock, campaigns),
- data errors genuinely hurt.
Slower where the company is small, has a single system and its reporting is enough. In that case the honest answer is “not yet” - and we’ll say it. For more on when yes and when no, see Data warehouse or Excel?.
How to reduce the risk of the investment
- Start with an MVP on the most painful area - value in weeks, not after a year.
- Measure before and after - how many hours the close takes today vs. after go-live. No numbers, no ROI.
- Prioritise by impact - first what most affects decisions or saves time.
- Keep your data and code - no vendor lock-in, so licences don’t eat your return.
Summary
Investing in data isn’t a cost - it’s a tool you can measure. If you plug your own numbers into the formula above, within five minutes you’ll know whether the project is worth it. And if you get a negative number, it’s better to know now than after the project.
Want to be sure what it will cost? See the article How much does a data warehouse or BI project cost. And if you’re still weighing what BI will bring you, start with What is business intelligence.
Want help calculating the return for your company? Check out our data strategy or get in touch - on a no-obligation consultation we’ll go through your numbers and prepare an estimate.